It’s been a while since we took an in-depth look at the numbers for the California cannabis industry. For several years, we did quarterly reports on the state of the industry and trends in licensing, regional growth, and cultivation. After a hiatus for 2025, we’re back with a full summary of what happened last year and since legalization. This will be the first of three reports published separately. This one is about the cultivation industry, while the second will be about the commercial side of the industry, and the last one will be on manufacturing. All of this information is collected from publicly available data in the State License Search. If you are trying to do your own research or need some more in depth information, you can use our improved version of the state license search here, now with additional graphs and data visible under the “Summarize Licenses” button. Without further ado, let’s get into the data for 2025!
Overall Cultivation Since Inception
Let’s start with a basic overview of the scale of the cultivation sector since licensing began in 2018.
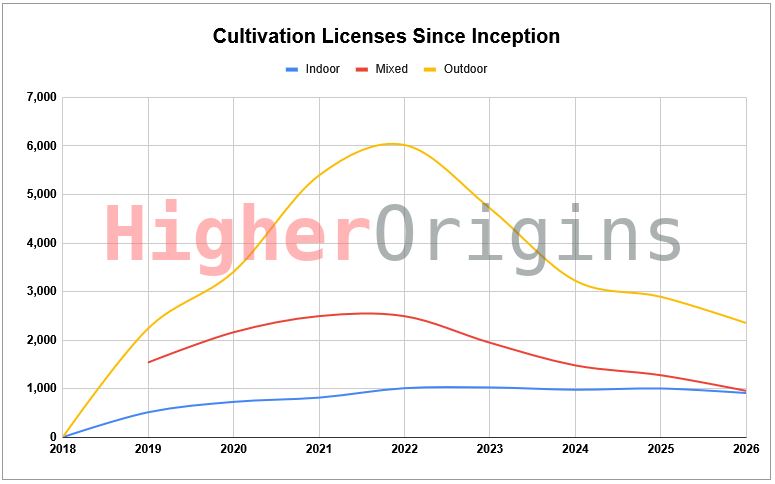
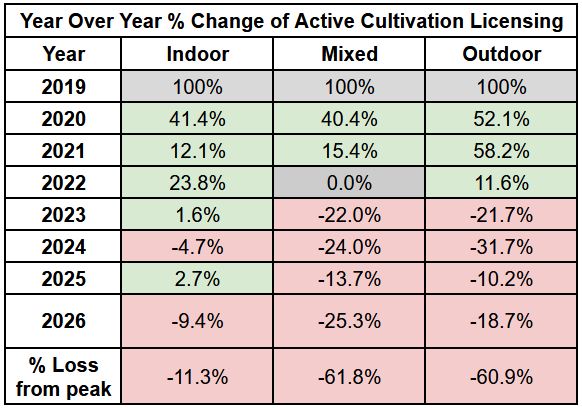
The largest license category is outdoor cultivation, which grew steadily from legalization and peaked in 2022. No mixed light was licensed at all in the first year, but it quickly shot up to second place, peaking in 2021. Indoor has been much more stable and grown more slowly, gradually leveling off from 2022-2025. Cultivation is in decline across all grow styles. Here’s a table of the year-over-year change percentages since 2019 when meaningful growth began.
Let’s look at this from a slightly different angle. Licensing is one way to track cultivation, but it doesn’t tell the whole story. Since there are different kinds of cultivation licenses that allow different sizes of canopy, the number of licenses doesn’t tell the whole story. This is why we prefer to track cultivation via square footage.
For example: County A has 10 licenses, and County B has two. If you only look at license counts, you could assume that County A had a larger crop. In fact, County A only has specialty cottage indoor licenses with up to 500 square feet of canopy, while County B has two medium indoor licenses with up to 10,000 square feet of canopy. Therefore, County A has 1/4th the canopy, despite having 5 times the amount of licenses.
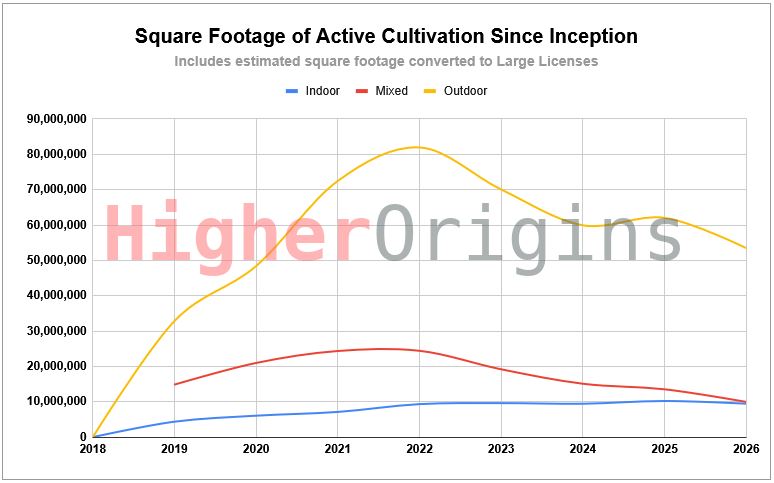
When looking at square footage, the chart is almost the same, except that outdoor cultivation consists of much more canopy than the license count would suggest. The trendlines are similar, just scaled proportionally to the amount of available canopy.
Cultivation by County
Let’s break cultivation down across counties. Since California has 58 counties with varying population, politics, and geography, the county level view makes sense for exploring regional differences.
A note about these charts: In many charts in this report, we have decided to only show the top 80% or top 10 licenses by county. This allows us to still show the main populations that are driving market trends statewide, while still being able to fit it on a chart for easy display. Please refer to the chart subtitle for information on what has been omitted. Note that some counties are not in the data set at all, since they do not allow certain cannabis activities.
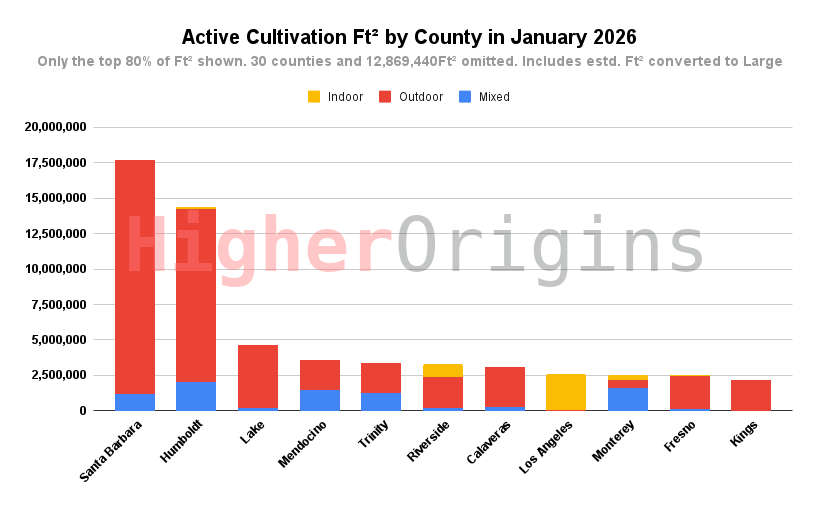
Santa Barbara and Humboldt farms are the biggest production category in the state, making up 44% of the state’s entire canopy. Most other counties in the top 80% are much more comparable. Los Angeles is an outlier for being completely indoor, as you would expect for a metropolis with limited space. Due to the ability for indoor canopy to be harvested multiple times a year, a good rule of thumb is to imagine that indoor canopy counts for 2-3x the annual production per square foot when compared to outdoor. Using this rule, it’s a reasonable assumption that LA is actually the 3rd largest cannabis producing county.
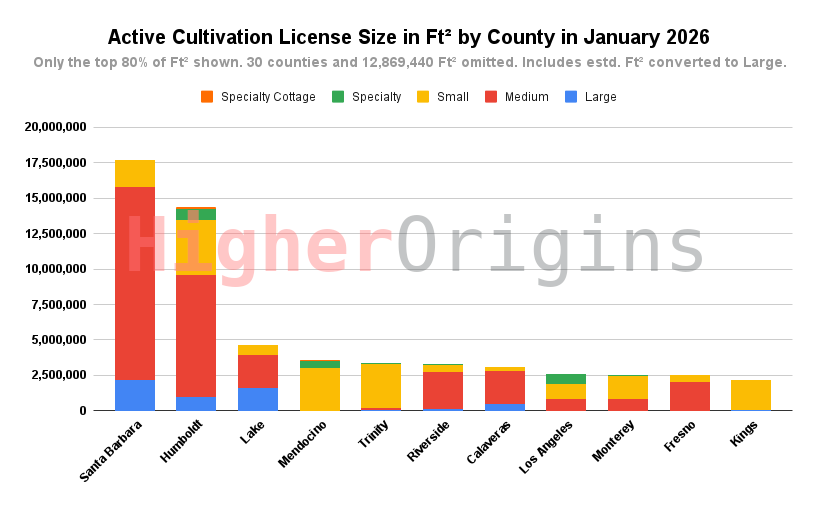
Looking at the same canopy numbers broken down by the size of license types lends a different perspective. Santa Barbara’s megafarms largely consist of many medium cultivation licenses stuck together, while roughly a third of Humboldt’s crop still is grown on small/specialty farms as it has been for decades. This bias for smaller licenses is clear across the rural mountains of the other Emerald Triangle counties of Mendocino and Trinity, while their neighbor Lake County is predominantly made up of larger operations. LA’s crop is evenly split across a variety of sizes, which makes sense considering it’s all indoor crammed into whatever industrial space was available.
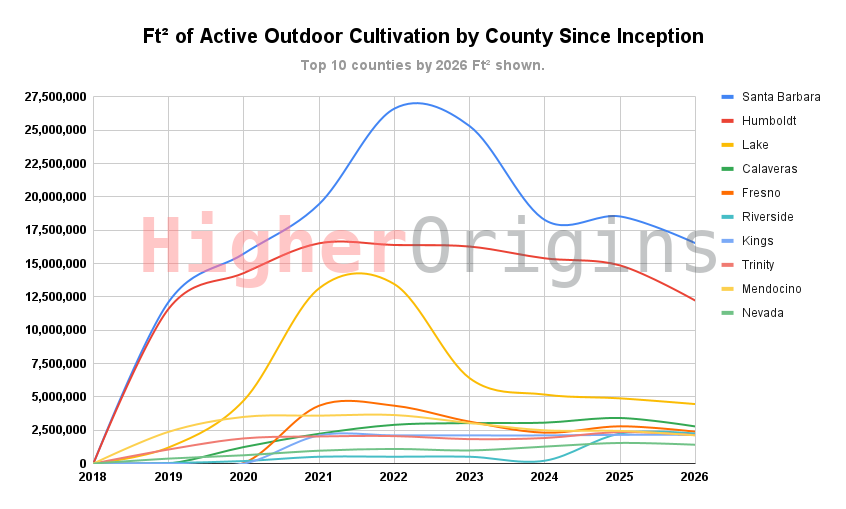
For outdoor cultivation, we can see that Santa Barbara, Lake, and to a lesser extent Fresno counties have experienced intense boom and bust trends. One thing to note about Lake County- much of the cultivation that was gained and lost between 2020 and 2023 was never actually cultivated. Several large investment companies secured licenses in the county, but little of it was actually cultivated. It’s harder to determine if this was the case with the Santa Barbara canopy as well, but it is a possibility. Humboldt stands out as a gentle curve- no big jumps or drops, showing more consistent investment and stability over time. Among counties with smaller crops, Riverside stands out for going from basically nothing to matching most counties over the course of a year.
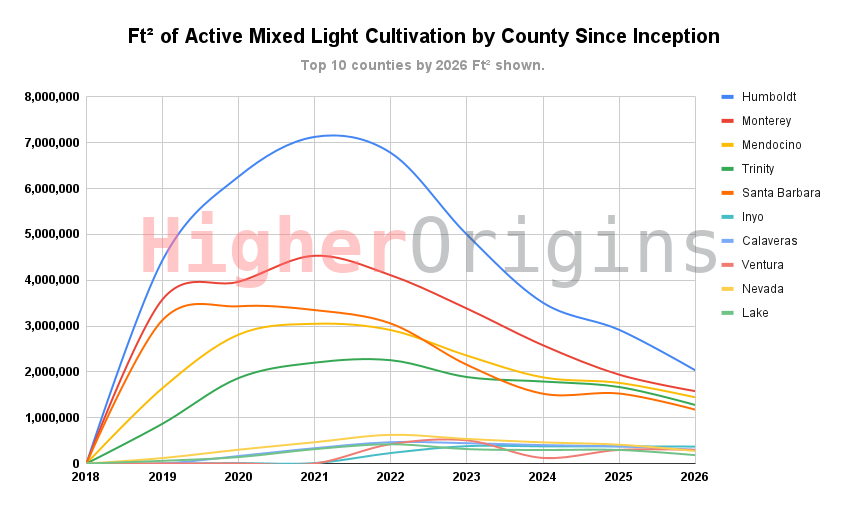
Pulling back the tarps and taking a look at mixed light, we see a fairly clear trend, with a peak in 2021 followed by a slow decline across the board. Monterey and Santa Barbara have some bumps, but largely follow the trend, with Humboldt’s 5 million square foot falloff from its 2021 peak being an impressive failure. On the smaller side, Ventura had a notable drop in 2024 but caught back up to similar sized counties. Currently, mixed light is tanking across the board, with stability seen only in smaller counties with a few hundred thousand square feet of canopy. It seems that the additional benefits of having your plants covered under glass or hoops doesn’t translate to increased financial stability when compared to outdoor.
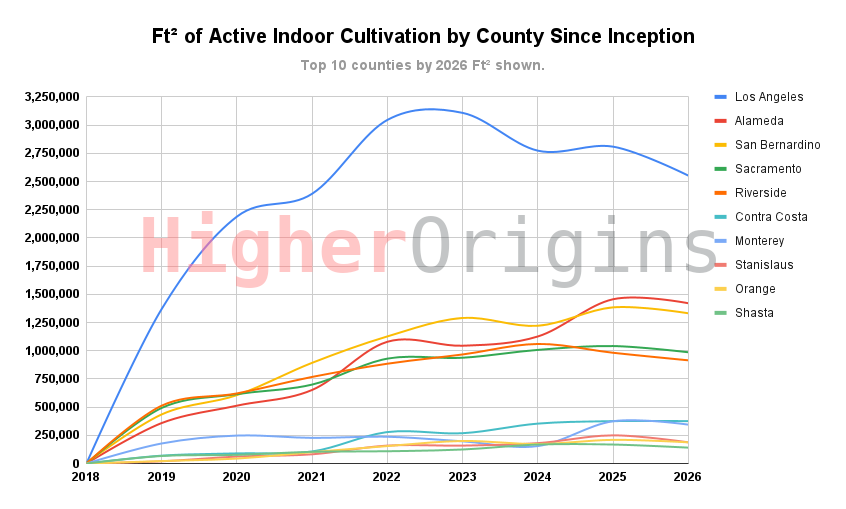
The great indoors represents the most stable sector of the state crop. While it has a much higher upfront cost to build out a facility, indoor allows constant harvesting when scheduled properly, allowing for more consistent income and faster adaptation to retail trends while demanding a premium price. Los Angeles absolutely runs the indoor game, with Alameda (home of the East Bay) coming in second. San Bernardino comes in a reasonable third, likely due to its urban center and arid desert environment making outdoor or mixed grows difficult, while offering a slightly cheaper alternative to real estate prices in nearby LA. Sacramento also delivers a healthy indoor crop, providing weed to consumers all along the urban Capitol Corridor while dodging the massive costs of operating in the Bay. 2025 was the first year where every single one of the top 10 indoor counties was flat or on a downtrend. As power bills and rent rise, megafarm outdoor craters the market, inflation eats consumer’s paychecks, and tariffs jack up the price of Chinese grow lights, the indoor market is finally starting to show cracks.
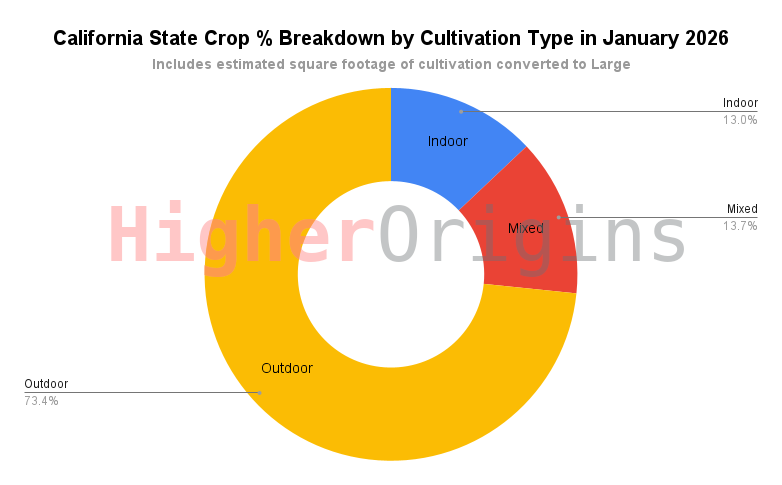
That was a lot of analysis, time for a donut break. This donut chart simply shows the percentages of the main cultivation types in California. While mixed and indoor are tied, remember that indoor can harvest more times per year, so it has a higher average output.
Large Licenses
Starting in 2023, California operators were able to get Large cultivation licenses. The point of this was to allow people who were previously operating many smaller licenses to consolidate them under one big license to simplify their bureaucratic workload. For analysts like us however, this poses a problem. All other license types have a stated canopy area limit- for example, a Small Outdoor license allows up to 10,000 square feet of canopy. This clear statement of the canopy limits makes it easy to track how much canopy is licensed across California. Unfortunately, Large licenses broke this by simply putting a lower limit- a Large Outdoor license allows any amount of canopy above 1 acre. This means that while we have a lower limit- at least an acre, we have no upper limit, so we can’t accurately determine Large canopy, and as a result can’t accurately determine overall statewide canopy.
Our solution to this has been estimation. Since Large licenses can be converted from many smaller licenses, we look at each individual Large license holder’s records and sum the total amount of inactive cultivation of the same type that they had prior to their large license. The assumption here is that their previous licenses were cancelled when they switched to a Large license, and the existing canopy was transferred to the Large license. In the event that a Large license holder has no matching previous cultivation, we can only assume that this is a completely new license and must default to the 1 acre minimum. This is an imperfect method, but it’s the best we can do with the limited information that we are given.
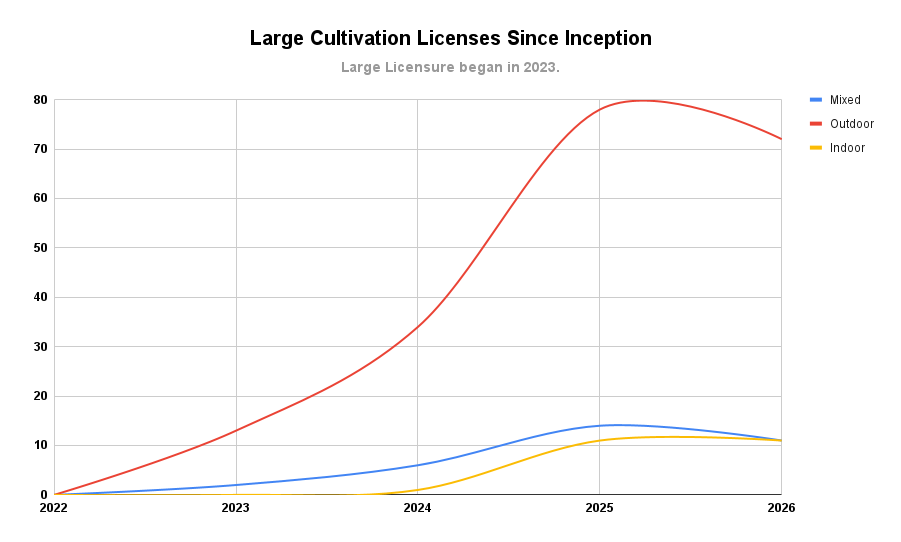
Now, with all that explanation out of the way, let’s look at the trends in Large licensing statewide since the program began in 2023. As usual, outdoor is king, with indoor and mixed light breaking even. License counts for outdoor and mixed are trending down, but indoor is basically flat. This mirrors the overall cultivation trends statewide.
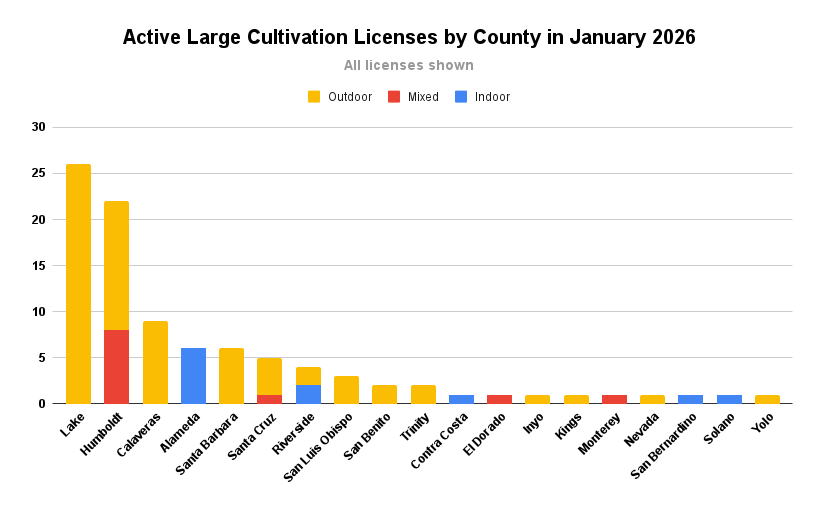
Isn’t it weird to see a cultivation chart without Santa Barbara in first or second place? They only have 6 large operations active at the moment. In terms of licensure, Lake County leads the pack, followed by Humboldt as a second outlier. Alameda dominates large indoor operations, showing that East Bay indoor is still alive and well. We’re curious if those large operations in Lake county are all actively being cultivated, or if this is a repeat of past trends where massive farms were licensed in Lake but were never actually operational.
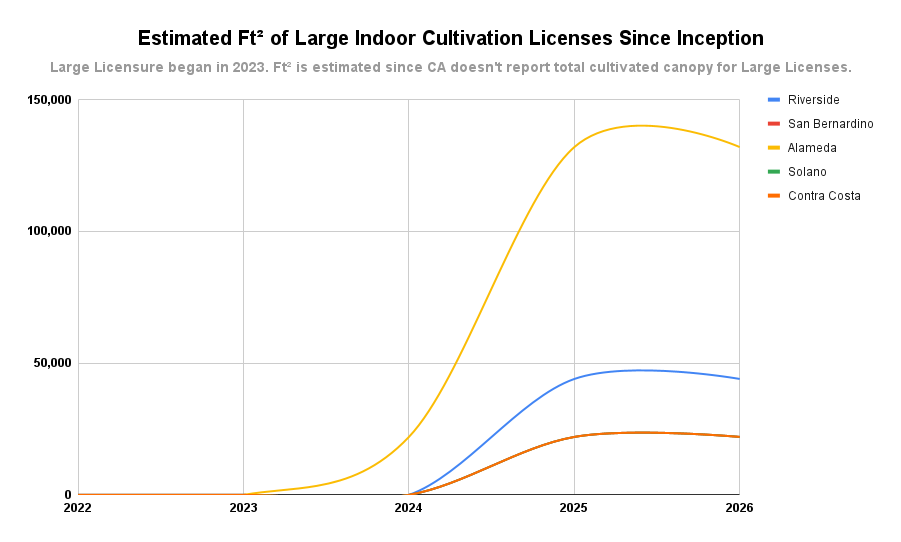
In terms of indoor square footage, we see that Alameda has around 140,000 square feet active, placing them far above other regions. Don’t worry, Solano and San Bernardino are there, they’re just hiding behind Contra Costa, tied with 20,000 square feet each. Surprisingly, the dominant indoor growing county, LA, has no large licenses. Perhaps the market there is already saturated, or real estate costs make larger operations unprofitable.
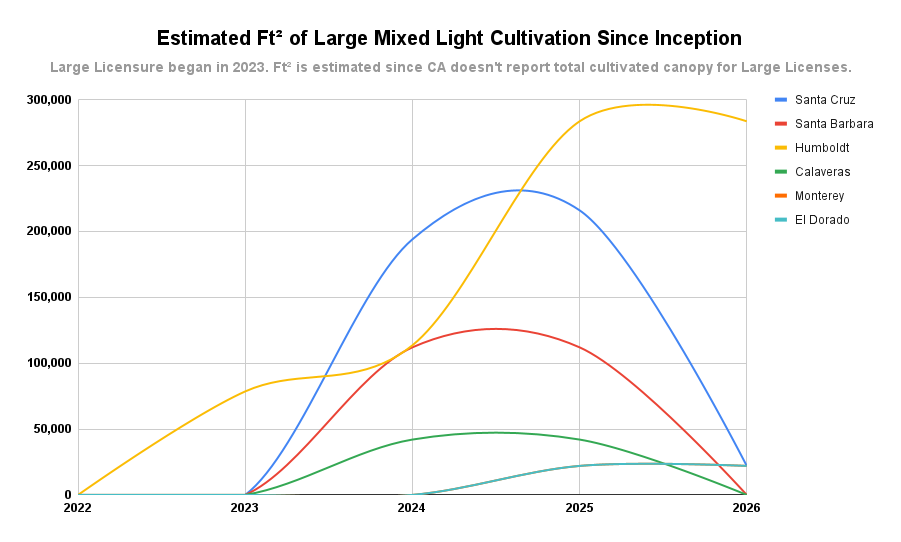
Large mixed light seems to have crashed everywhere except for Humboldt county. Behind the redwood curtain, hoop houses are a common way to get a slightly earlier crop in and steer the crop more effectively than with the region’s traditional sungrown. It seems like growers there are doubling down on this method with bigger crops, even as the overall mixed light canopy in that county has dropped significantly.
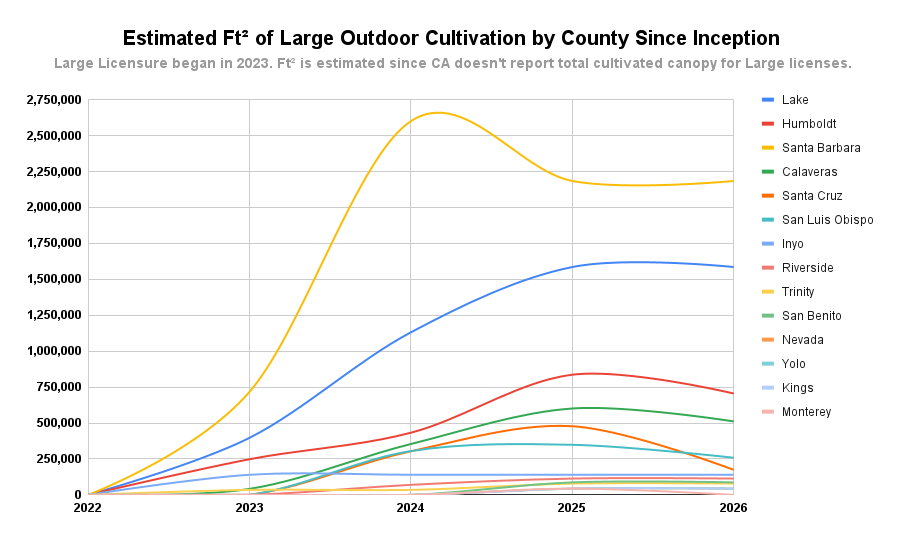
Despite only having six Large licenses, Santa Barbara dominates the outdoor category, even managing to stay flat over the past year. All counties are either flat or trending downwards.
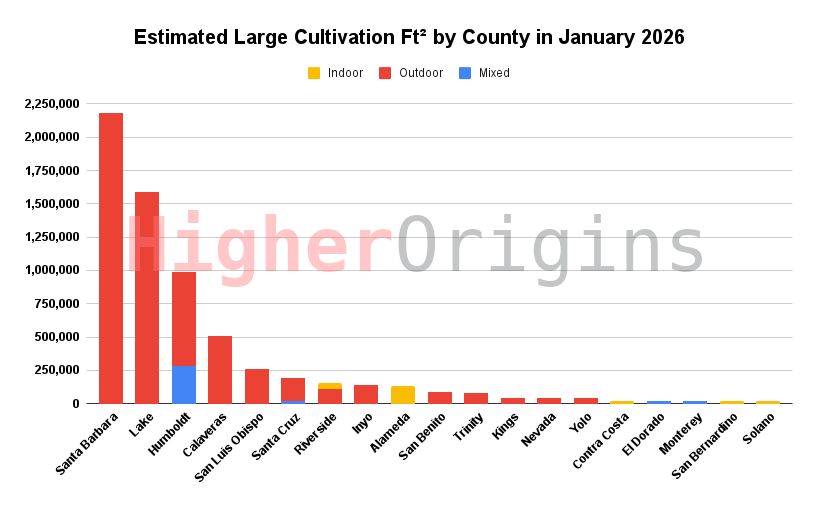
And finally we see the overall square footage of Large licenses by county as of the beginning of 2026. While Lake and Humboldt have the most licenses, Santa Barbara has the most estimated cultivation by far. This does highlight the concentration of licensure in these counties. Santa Barbara’s Large cultivation is held under just 6 licenses, while Lake has 26 and Humboldt has 22. This means that Santa Barbara’s dominance in Large cultivation could be threatened by just one license loss, and that one license loss could have significant industry shockwaves due to the amount of customers it serves. Considering the historical instability of big cannabis operations, concentrated ownership like this could pose a threat to regional market stability.
Big Businesses
Speaking of concentrated ownership, who are all these big cannabis businesses? We pulled the numbers, and it turns out all the big players are almost entirely outdoor cultivation. Here’s a breakdown of the top 10 operators across the state by canopy area:
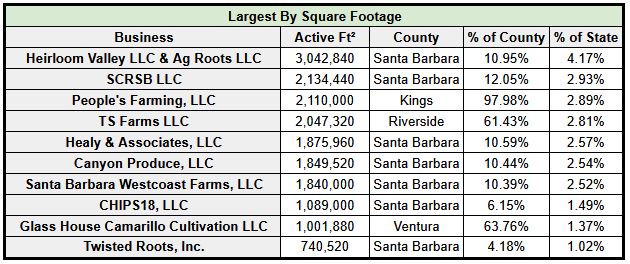
Special Findings About Some top Farms
We did some research, and found a few key pieces of info about some of these farms that change the top 10 results:
Heirloom Valley LLC and Ag Roots LLC: While they show up in State records as two separate businesses, these two huge farms just outside of Lompoc are owned by the same family and are right next door, with satellite images indicating they share facilities and a driveway. The owners run Pro Farms, so it’s likely that these farms supply that business. Therefore, it makes more sense to consider these to be one farm, which would make it the largest farm in the state by square footage (after perhaps the farm below).
Healy and Associates and Canyon Produce: These two farms have shared ownership. The only owner of Healy and Associates is also one of three owners listed for Canyon produce. Also, the farms are just a few miles apart West of Los Alamos. We can’t be certain that these farms operate as a single entity, so we don’t feel comfortable combining them in this ranking. If they were confirmed to operate together, this would make them the biggest farm in the state with over 3.7 million square feet of canopy.
GBH Cultivation LLC: This business initially ranked 8th overall statewide. All licenses associated with this business are now listed as “Limited Operations” meaning that the farm is not growing at full capacity. This usually indicates that the farm is on the way out of business or the owners are trying to cut their losses and sell it. While we consider this farm to still be “Active” since they can conduct some cultivation, farms in jeopardy like this shouldn’t really be considered in the top 10 so we have left it out.
If you’d like to do more research on these megafarms, here’s a list of links and information to start with:
Heirloom Valley LLC:
Ag Roots LLC:
SCRSB LLC:
People’s Farming LLC:
TS Farms LLC:
Healy and Associates LLC:
Canyon Produce LLC:
Santa Barbara Westcoast Farms
GBH Cultivation LLC:
CHIPS18 LLC
Likely partnered with Central Coast Agriculture, and therefore Raw Garden
Glass House Camarillo Cultivation LLC
Twisted Roots Inc
And that’s all for this report! We’ve looked at the trends in licensing and square footage since legalization, regional concentrations of different types, large licenses, and the biggest farms in the state. We’re always happy to dig into the data, so if there’s anything you want to know that we didn’t include, let us know and we’ll add it! Stay tuned for more reports in the near future on the commercial and manufacturing sectors of the industry, followed by some more in depth reporting on a few other hot topics.
Higher Origins exists to get small cannabis farms to market. Insights like these are a way for us and our readers to better understand the market so we can help small farms in the most informed way possible. If you are a licensed California cannabis operator and would like to source from small farms, or if you own a small farm yourself and would like to get your products out into the market more easily at a better price, sign up for Higher Origins. Signup is free and gets you a professional menu tool, the Marketplace, ordering, a public profile page to tell your story, and more! If you appreciate what you’ve read today, tell your friends and share it far and wide! We can all agree that the California cannabis industry desperately needs more informed and thoughtful decision making, and insights like these can help.
Thanks for reading, and stay tuned for the next one!
-The Higher Origins Team

Comments (0)
No comments yet. Be the first to join the conversation!